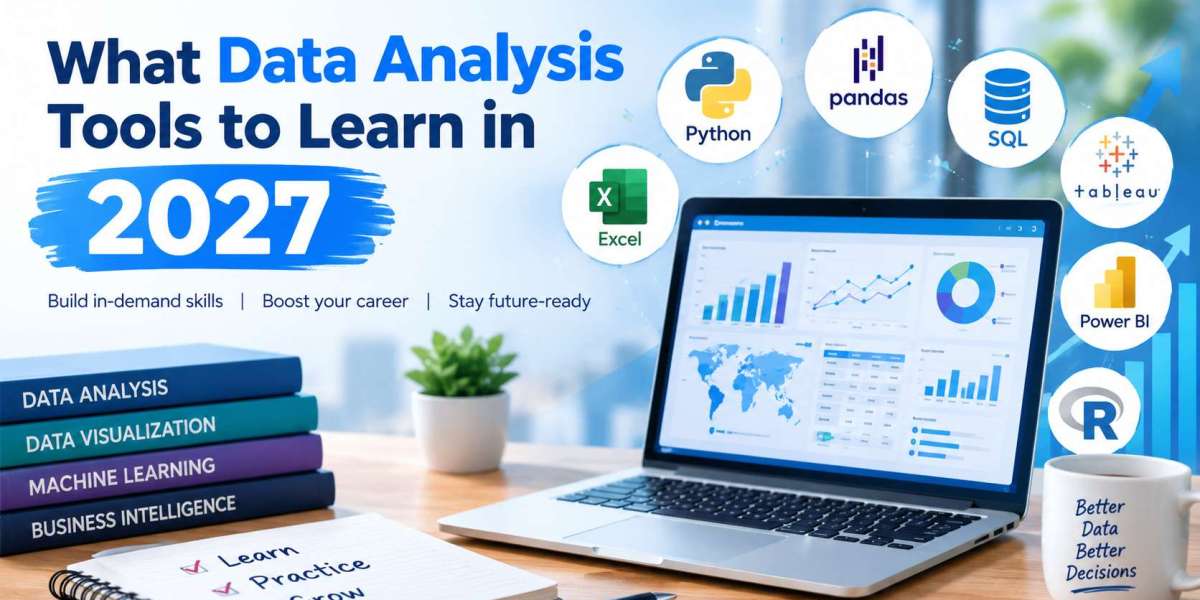

Data analysis involves spreadsheets, databases, programming languages, BI platforms, statistical packages, large scale processing engines and AI assistants, often in the same project.
What employers want is changing too. What employers want is changing too. The Stack Overflow Developer Survey 2026, which polled over 30,000 developers across 169 countries, found SQL now sits in second place among the most-used languages at 58.4%, just ahead of Python at 58%, a clear sign of how tightly querying and programming skills now travel together in real data work.
The right tool depends on your data, the question you’re answering and how complex the work gets, so this guide covers eight data analysis tools for 2027 worth knowing and when each one earns its place.
Best Data Analysis Tools in 2027
Tool | Best for |
SQL | Databases to question and change |
Microsoft Excel | Spreadsheet analysis |
Python | Advanced analytics and automation |
Power BI | Business Intelligence & Dashboards |
Tableau | Visualizing data |
R | Statistics analysis |
Apache Spark | Massive data crunching |
ChatGPT | Data analysis supported by AI |
● Most analysis starts with SQL because it’s how you get, filter, and join records from the relational databases that companies use to store their data. From there it’s all Excel for quick exploration, pivot tables and what-if models and finance and operations teams still use it every day.
● Python is better for jobs requiring automation or machine learning where pandas, NumPy and Matplotlib handle most analytical work and a single script can rebuild a weekly report in seconds.
● Results sharing is a clear winner for Power BI and Tableau. Power BI fits well inside organizations that already have Microsoft 365 and connects to dozens of data sources. Tableau is a favorite for fast visual exploration and polished, presentation-ready charts.
● R is for a more specialist audience. It has been developed by statisticians to support statistical modeling, hypothesis testing and research-grade graphics with packages such as ggplot2, making it popular in academia, healthcare and pharmaceuticals.
● At the other end of the scale is Apache Spark, which distributes processing across clusters so analysts and data engineers can work with datasets far larger than a laptop can handle.
● ChatGPT rounds out the list as a daily assistant, writing SQL and Python, explaining weird code, summarizing findings, and answering plain language questions about uploaded data.
How to choose the right data analysis tool?
The simplest way to choose is to begin from the task:
● Excel: Quick business analysis and calculations
● SQL: Querying data stored in databases
● R: Statistical analysis and research
● Python: Advanced analysis, automation, and machine learning
● Power BI or Tableau: Building dashboards and presenting insights
● Apache Spark: Processing very large datasets
● ChatGPT: Exploring data, explaining code, and speeding up analysis
Most analysts build a core toolkit of three or four tools and add others as their projects require.
How Is AI Changing Data Analysis?
A practical learning path is to start with Excel, then move to SQL, Power BI or Tableau, and finally Python, depending on your career goal:
● Excel: Build data intuition and learn basic analysis
● SQL: Work with real databases
● Power BI or Tableau: Present insights through dashboards
● Python: Add automation, deeper analysis, and machine learning
For business analysis, spend more time on Excel and BI tools. For data science, move to Python and statistics sooner.
What Skills Are Important Beyond Knowing the Tools?
Good data analysis is more than just knowing the tools. Key skills:
● Data Cleaning
● Statistics
● Analytical Reasoning
● Data Visualization
● Storytelling with data
● Critical analysis of AI generated analysis
Analyzing data is not only about choosing the right software. This USDSI® resource explores the key data analysis techniques, the steps in the analysis process, and how businesses use data to make decisions. It is a useful companion for readers who desire to strengthen the analytical concepts underlying the tools discussed in this article.
Do You Need Certification to Develop Data Analysis Skills?
All the tools in this guide can be learned through practice and projects, so a certification isn’t a requirement to start. What it does add is structure to that learning and a clear signal to employers that you understand the broader analytical process, not just one piece of software. Listed below are top data science certifications.
USDSI® Certified Data Science Professional (CDSP™)
USDSI® Certified Data Science Professional (CDSP™) is an introductory credential in data analysis, visualization, databases, big data and machine learning. That breadth prepares you for the whole analytical workflow, giving you a more versatile grounding than just mastering one tool.
Professional Certificate in Data Analytics: University of California, Berkeley
A Professional Certificate in Data Analytics – University of California, Berkeley is a US university led program to build practical skills in data analysis, statistics, visualization and communicating data driven insights.
University of Oxford: Data Analytics Program
A University of Oxford: Data Analytics Program is a course by a UK university on data analysis, statistical thinking and evidence-based decision making for working professionals.
Summing Up
SQL, Excel, Python, BI platforms, R, Spark and AI are all tools that solve a different analytical problem. Strong analysts develop a practical toolkit around their work and know precisely when to use each tool.
FAQs
Q. Can I become a data analyst with only Excel and SQL?
- Yes, many entry-level roles start with those two skills. Adding a BI tool and Python widens your options considerably.
Q. Is Python still worth learning if AI can generate code?
- Yes, because Python knowledge lets you review, fix and improve the code AI writes.
Q. Is R still used in professional data analysis?
- Yes, it remains common in research, healthcare and pharmaceutical analytics.
Q. Are AI tools reliable for analysing business data?
- They're excellent for speed and exploration. Verifying their calculations and conclusions keeps your results dependable.