Want to translate your complex data into clear and actionable insights? The United States Data Science Institute (USDSI®) presents a comprehensive infographic on “Simplified Power BI Architecture for Seamless Data Flow”, designed for professionals, business analysts, and decision-makers, simplifying how Power BI transforms raw data into meaningful intelligence.
In this infographic, you will learn about the complete data journey, right from collection to preparation to modeling and visualization. The infographic highlights how data from multiple sources are unified, cleaned, and processed before they are converted into interactive dashboards that facilitate data professionals and decision-makers with real-time decision-making.
Power BI provides a seamless and scalable ecosystem across all platforms, whether you are working with cloud apps, databases, or APIs.
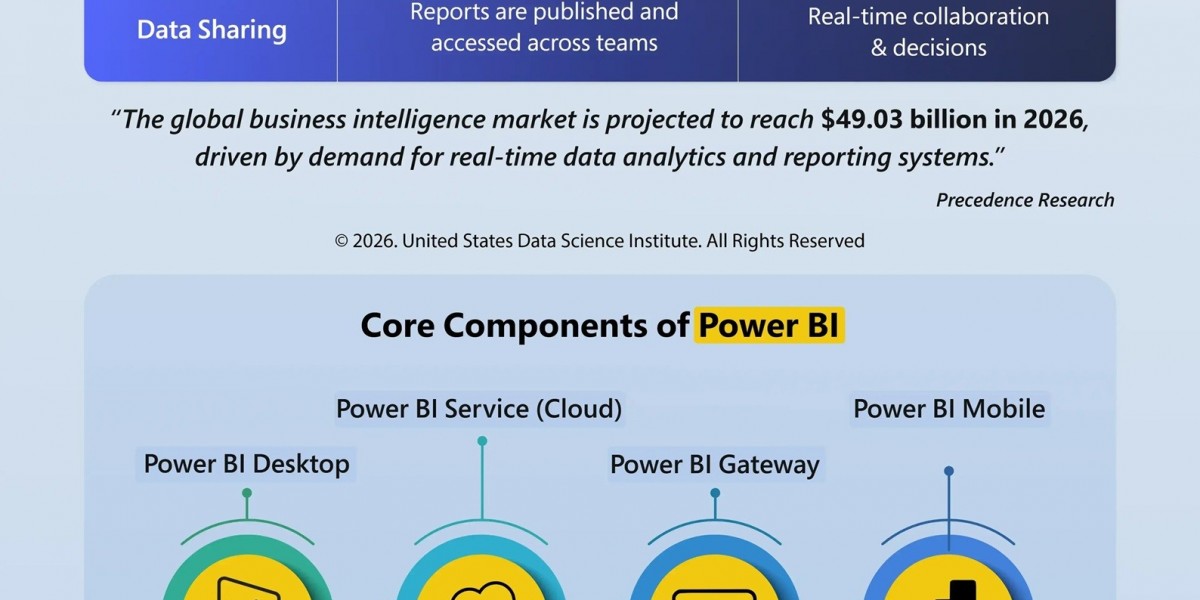
Moreover, you will also explore core components of Power BI, such as Power BI Desktop, Service, Gateway, and Mobile, along with other key technologies like DAX and Power Query that power advanced analytics.
This infographic highlights some real-world use cases across finance, healthcare, retail, and operations, demonstrating how organizations across various industries can leverage this incredible data science tool to stay competitive.
With the global business intelligence market soaring, everyone must be aware of tools like Power BI to enhance their data science workflow. This infographic serves as the perfect quick reference guide to master the fundamentals quickly and enhance data analytics skills and knowledge confidently.